
Signal-to-Noise Ratio
SNR (Signal to Noise Ratio) is the fundamental metric used to evaluate the performance of a radar system.
This ratio compares the received signal power from a target against the background noise,
that originates within the system itself, primarily from thermal and phase noise.
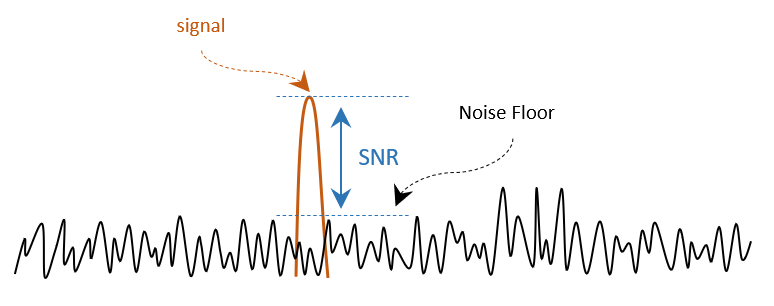
1. Impact of SNR
A high SNR is critical to minimize false alarms and enhance measurement precision.
If the SNR is too low, the target signal becomes indistinguishable from the noise floor,
leading to missed detections or increased False Alarm Rates.
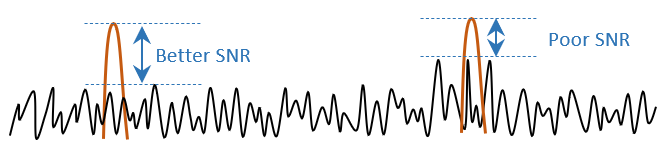 |
A higher SNR reduces detection errors and enhances measurement precision. |
|
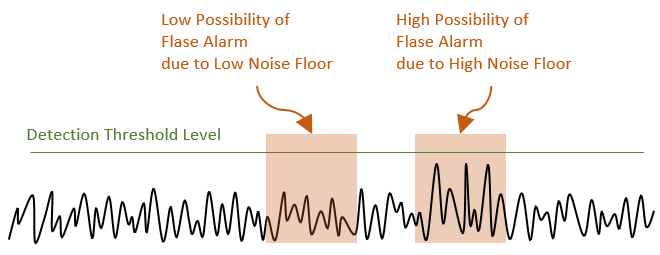 |
False alarms occur when time-varying noise is too high |
2. Supplementary: SCNR
SCNR (Signal-to-Clutter-plus-Noise Ratio) is a more realistic performance metric than SNR.
In real-world applications, the system is limited not just by internal noise, but by clutter.
Clutter refers to unwanted reflections from stationary objects like walls, furniture, or appliances.
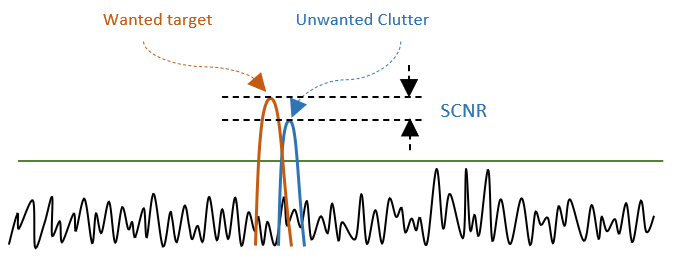 |
Clutter can lead to false alarms and measurement errors by interfering with target detection. |
3. Noise Source in Radar
| Category | Noise Source | Spectrum Characteristics | |
| Thermal Noise |
LNA, Mixer, ADC, resistors, internal RF receiver thermal noise |
Flat noise floor across the entire spectrum | |
| Static Clutter |
Walls, floor, ceiling, furniture, fixed objects, stationary human body |
Strong peak near 0 Hz Doppler or fixed range bins |
|
| Dynamic Clutter |
Curtains, fans, air conditioners, plants, vibrating or moving objects |
Spread energy in low Doppler regions with temporal variation |
|
| Multipath Clutter |
Reflections from walls, ceiling, floor, metallic objects, corner reflections |
Ghost peaks at incorrect range/doppler positions | |
| External Interference |
Other radars, Wi-Fi, Bluetooth, LTE/5G, SMPS, motors, fluorescent lamps, inverters |
Narrowband tones, spurs, spikes, or elevated spectrum regions |
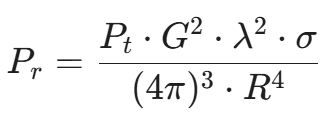
4. SNR Calculation Example
 |
|||||
| Parameter | Symbol | Value | Converted Value | Descritpion | |
| Transmit Power | P_t | 10 dBm | 0.1 W | ||
| TX Antenna Gain | G_t | 8 dBi | 6.31 | Conversion to Linear Gain | |
| RX Antenna Gain | G_r | 8 dBi | 6.31 | Conversion to Linear Gain | |
| Wavelength | λ | 12.4 mm | 0.0124 m | ||
| Target RCS | σ | 0.5 m² | Estimated RCS of Stationary human | ||
| Range | R | 8 m | Target Distance | ||
 |
|||||
 |
|||||
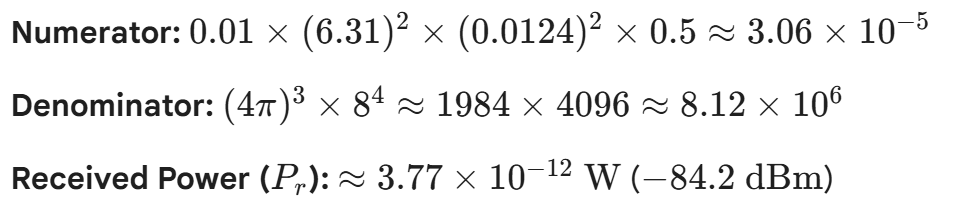
| Parameter | Symbol | Value | Converted Value | Description | |
| Thermal Noise Density | k•T | -174 dBm/Hz | |||
| IF/Baseband Bandwidth | B | 1 MHz | 60 dB-Hz | Conversion to dB | |
| Noise Figure | F | 10 dB | |||
 |
|||||


Radar Sensor SoC & Module

WiFi IoT Module

5G/LTE/CAT-M1/NB-IoT

WiSUN/HaLow/Thread Module
