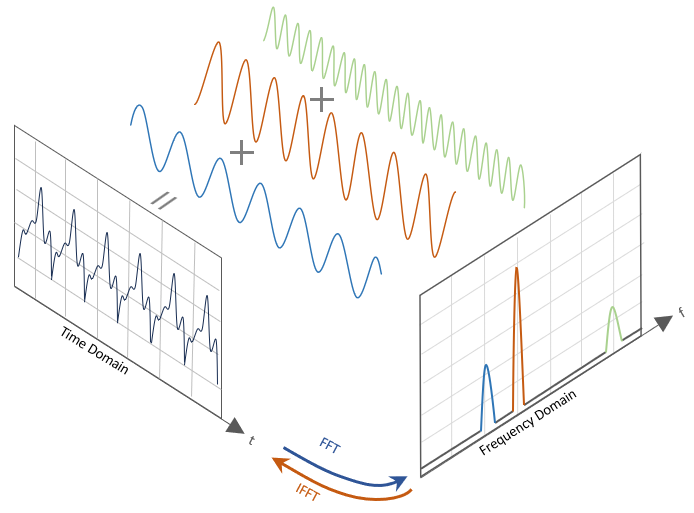
2. Signal Processing
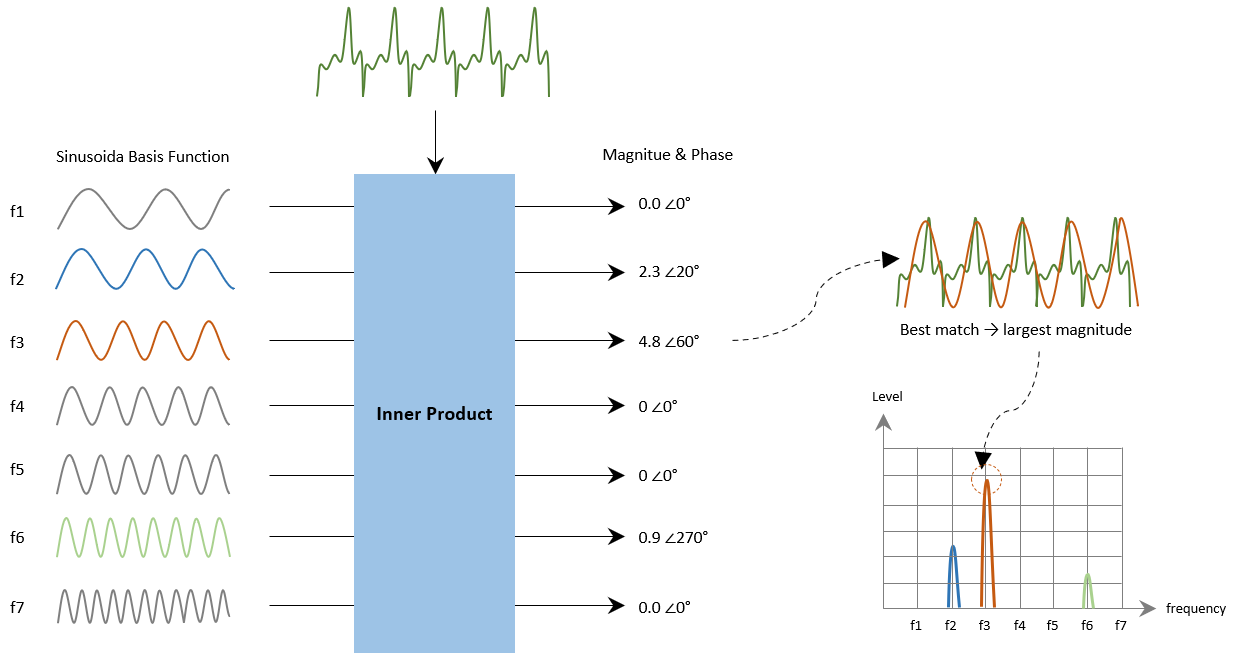
Specifically, the transform calculates the inner product between the input signal and sinusoidal basis functions.
This process measures their similarity, effectively decomposing the signal into its constituent frequency components for quantification.
3. Representation and Interpretation
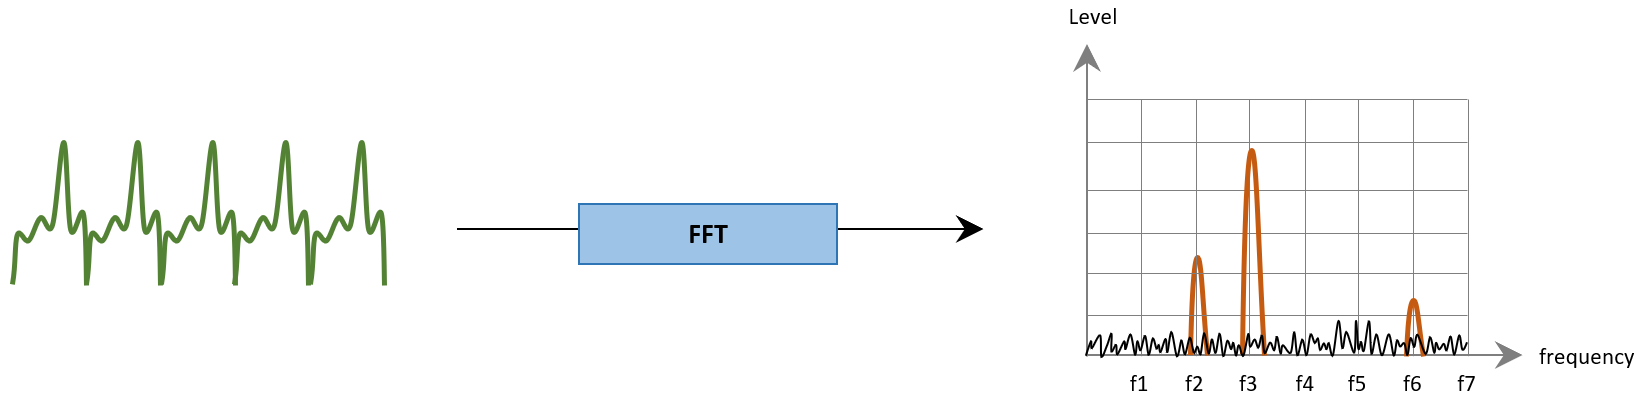
The FFT result provides a visual mapping of the frequency components that constitute an arbitrary time-domain signal.
Based on the principle of similarity, the spectrum identifies dominant frequencies through the following interpretations:
1) Component Identification:
High-amplitude peaks pinpoint the dominant frequency components
where the signal most closely matches the sinusoidal basis, with each peak’s height quantifying that component’s strength.
2) Signal Environment Analysis:
Beyond individual peaks, the overall distribution reveals the signal’s distinct characteristics and noise floor,
providing a comprehensive profile of the signal’s quality and its operational environment.
3) Phase Information:
The FFT result contains both magnitude and phase information.
While the spectrum focuses on magnitude to show frequency strength,
the phase components are vital for Doppler analysis and will be covered in detail in later sections.
.
4. Radar Application
In radar systems, the FFT is the core engine used to extract vital physical information.
While Range FFT identifies a target’s range and Doppler FFT estimates its velocity.
As the most fundamental signal processing framework, its principles are inherited by and integrated into nearly all advanced radar algorithms.
![]()
Radar Sensor SoC & Module
![]()
WiFi IoT Module
![]()
5G/LTE/CAT-M1/NB-IoT
![]()
WiSUN/HaLow/Thread Module
![]()