Energy Heat-map
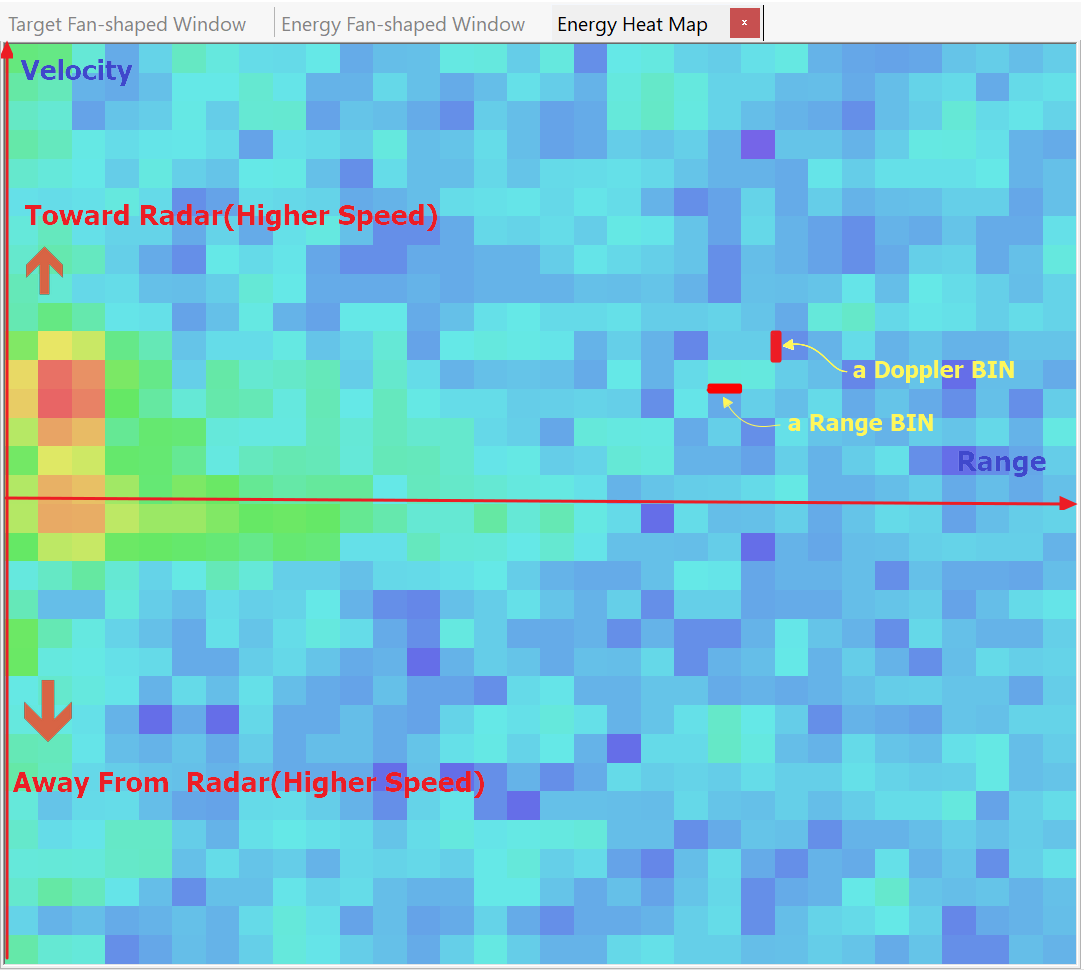
Energy Heat Map display the energy distribution within detection range.
RD-MAP allows you to intuitively determine the range and speed of an object.
it can be showed as the the results of Range FFT and Doppler FFT.
1. Energy Heat-map Notation
|
X axis (1DFFT Output Size) |
Represents range or range gate. ♦ Range gate 0 lies at left side |
|
|
Y axis (2DFFT Line Num.) |
Represents velocity. ♦ Velocity in the center is 0 ♦ Upward represents the increase of speed towards the radar ♦ Downward represents the increase of speed away from the radar |
|
| Color Temperature |
Stands for energy level. ♦ Cold(Blue) color represents low energy, the lower the energy, the more likely there is no object. ♦ Warm(Red) represents high energy, the higher the energy, the more likely the object is. |
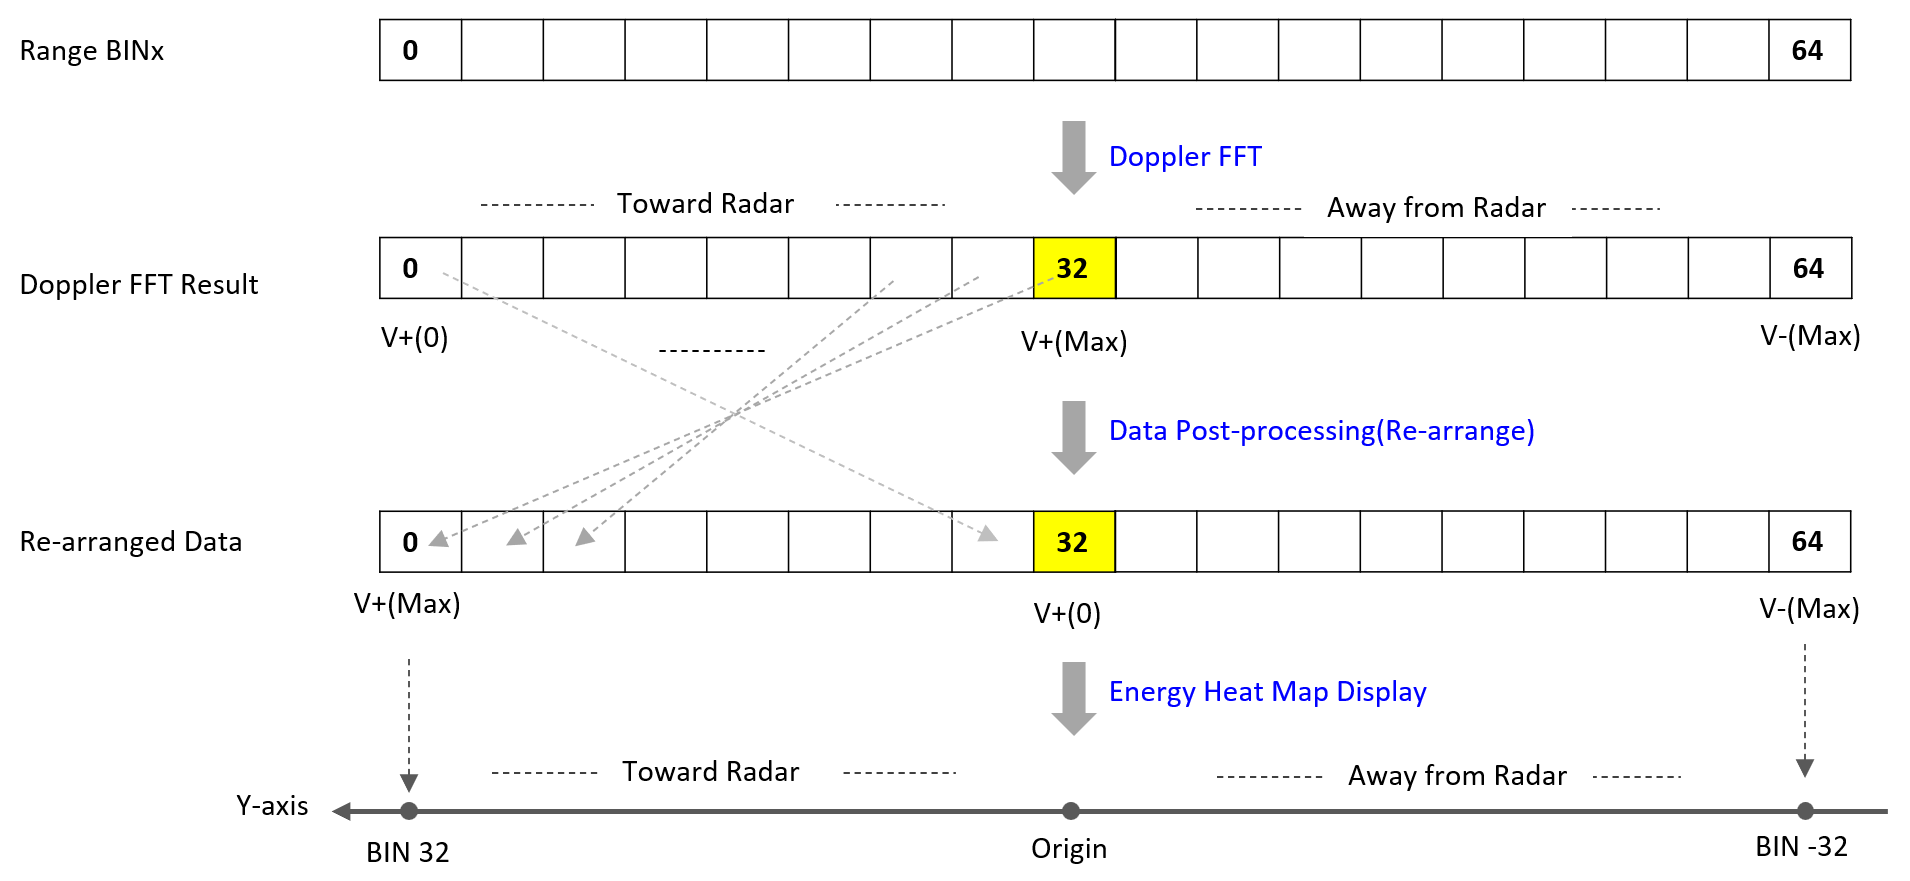
2. Energy Heat-map Basics
Actually, the Y axis (velocity) does not express the Doppler FFT results in the data order,
but rather rearranges the FFT results for intuitive interpretation.
3. Energy Heat-map Examples

WiFi IoT Module
![]()
Bluetooth Module
![]()
5G/LTE/CAT-M1/NB-IoT
![]()